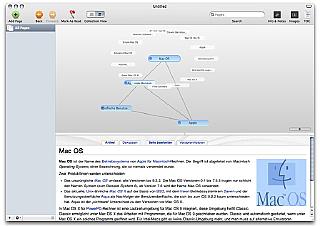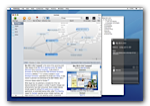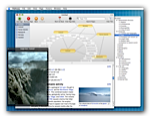
[The] aim [of Pathway] is to help you discover Wikipedia without having to worry whether youll have enough time to read everything you want, or if youll get lost.
It accomplishes this by presenting you with a graphical network representation of your visited article pages. A node represents an article, a connection between two nodes means, of course, that youve gone from the first article to the second one. You can save the network youve created to disk and recover it.
This way, youre able to keep track of everything: what youve looked at, how you got there and just how it all fits together.
Pathway has a small but useful feature set, is easy to use and tries not to get in the way. Written in Cocoa, it offers the elegance youd expect from a native Mac application.
Hmm, native Mac, somit nichts mit schnell Ausprobieren 


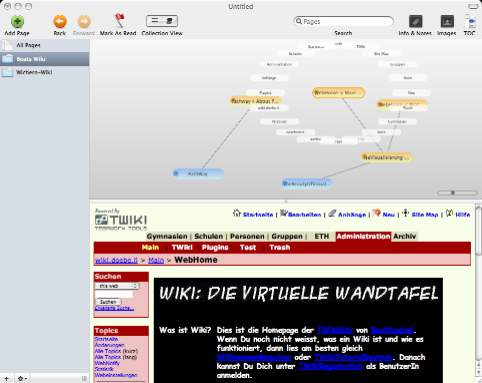
Visualisierung des Beat-Wiki mit Pathway. Das funktioniert sehr schön, danke für den Tipp! TO
