Visualisierung
Visualisierung Archive
- 1Dec 2025
- 1Jul 2024
- 1Jun 2020
- 1Jan 2013
- 1Apr 2011
- 1Dec 2010
- 1Mar 2010
- 2Sep 2009
- 3May 2009
- 2Mar 2009
- 1Feb 2009
- 1Dec 2008
- 1Nov 2008
- 1May 2008
- 1Apr 2008
- 4Oct 2007
- 5Aug 2007
- 2Jul 2007
- 1Jun 2007
- 2May 2007
- 3Apr 2007
- 2Feb 2007
- 2Jan 2007
- 1Dec 2006
- 1Nov 2006
- 1Oct 2006
- 5Sep 2006
- 5Aug 2006
- 1Jul 2006
- 2Jun 2006
- 2Apr 2006
- 1Aug 2005
- 1Jul 2005
- 1Jul 2004
Visualisierung, Aug 2006
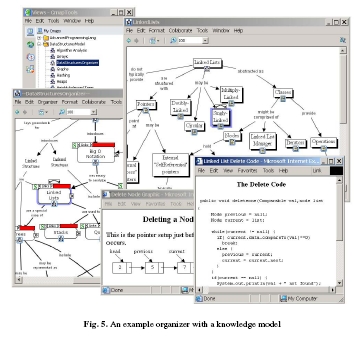
As expected DPM is not the first try to visualize didactic processes. In the book chapter LEO: A Concept Map Based Course Visualization Tool for Instructors and Students  ) (Biblionetz:t04914) John W. Coffey presents an extension of the concept mapping software cmap (Biblionetz:w01642) as a tool for planning and delivering education courses. He argues that the resulting concept maps can be used as advance organizers (Biblionetz:w01732) by students.
IsInEnglish
) (Biblionetz:t04914) John W. Coffey presents an extension of the concept mapping software cmap (Biblionetz:w01642) as a tool for planning and delivering education courses. He argues that the resulting concept maps can be used as advance organizers (Biblionetz:w01732) by students.
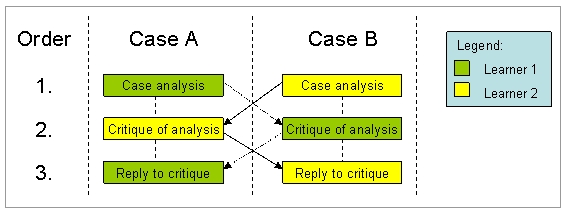
I'm playing around with my new tool to visualize learning scenarios. The jigsaw method seems to be a touchstone: Will it be possible to grasp the essential of this famous learning scenario?
A first approach is not very promising:
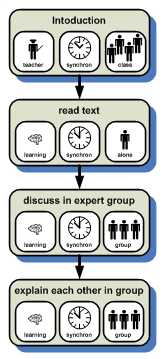
The distribution algorithm into differt groups (expert group and teaching group) is not visible. What if I take the perspective of one learner:
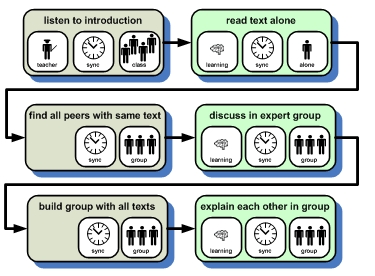
Hmm, I'm not yet convinced. But at least a student now knows what he or she has to do.
I'll keep trying.
IsInEnglish
Are there other visualizations of learning scenarios? Yes there are 
Source: Biblionetz:t06220
Source: Homepage CoSSicle Project
IsInEnglish
Source: Biblionetz:t06220
Source: Homepage CoSSicle Project
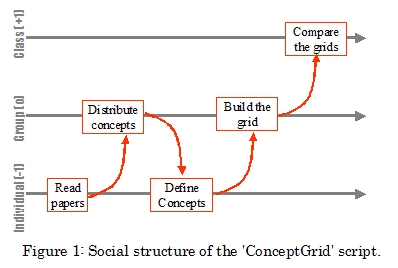
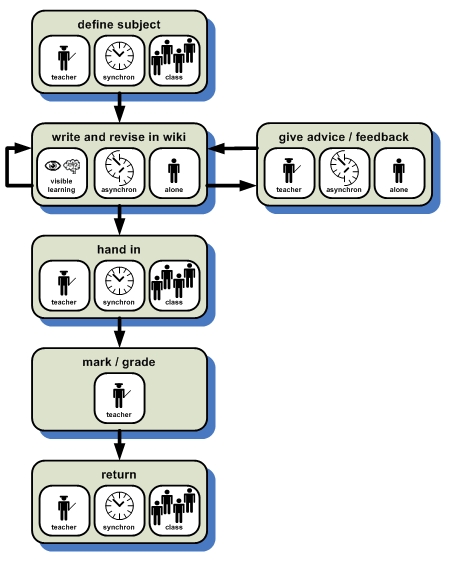
To describe and discuss about learning scenarios a common domain specific language. In his paper Overscripting CSCL (Biblionetz:t02367) Pierre Dillenbourg (Biblionetz:p01285) proposes such a language called collaboration script: 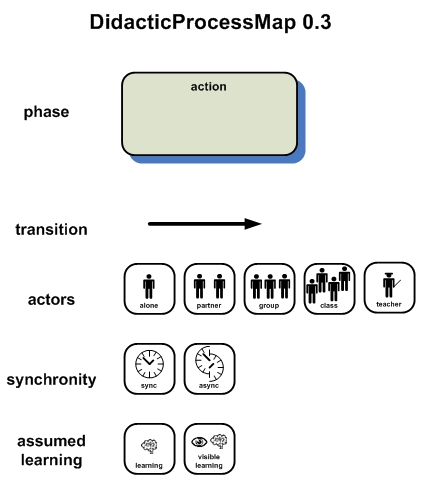
With this elements we can now describe learning scenarios. An example:
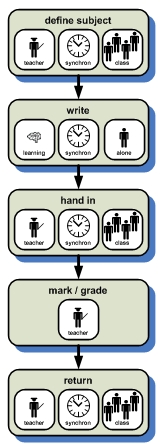
The teacher defines (and explains) the subject of the essay the students have to write. During one single time period each student writes his own essay. At the end of the predefined time period each student hands in his essay. The teacher reads, marks, and grades them. At the end he returns the essays.
What about doing the essay as homework?
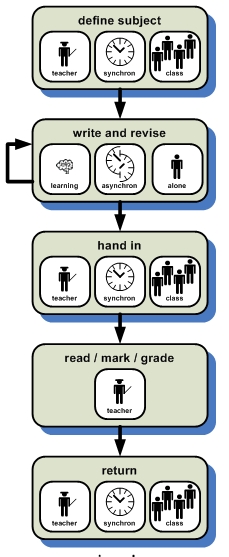
Hmm, and what if the students would write their essay in wiki?
More to come ...
IsInEnglish
- A collaboration consists of sequential phases.
- Each phase is described with five attributes: task, mode of interaction, group, timing, distribution.
Vorgestern habe ich mich wieder einmal darüber geärgert, dass die Usability von SVG-Viewern einfach mangelhaft ist. Im Firefox kann ich gar nicht verschieben und zoomen und im Plugin von Acrobat sind diese Möglichkeiten so versteckt, dass kein Mensch von selbst auf die Idee kommt, dass und wie das gehen könnte. Keine Rede von intuitiv.
Aber was gibt's denn für Alternativen? Eine Webrecherche hat nicht viel Neues gebracht. Schlussendlich bin ich beim LinkBrowser von Touchgraph gelandet, einem Open Source Java Programm bzw. Applet.
Einen Tag Programmieren später gibt's erste Ergebnisse im Biblionetz auszuprobieren:
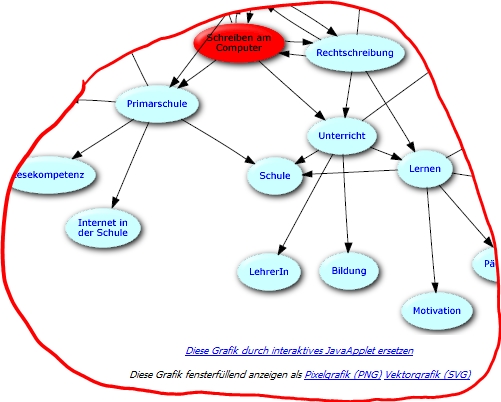
Unterhalb von Graphiken gibts jetzt neue Links zum Klicken: Einerseits kann die Grafik als browserfüllende Pixel- oder Vektorgrafik angezeigt werden (PNG bzw. SVG). Interessanter ist der Link Diese Grafik durch interaktives JavaApplet ersetzen . Vorausgesetzt Java und Javascript sind aktiviert, sollte beim Klicken folgendes erscheinen:
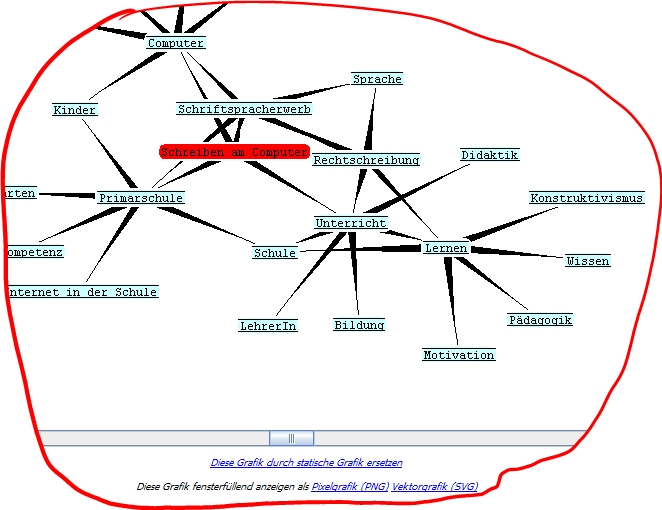
Das Applet erlaubt zoomen, verschieben und rotieren des Graphen. Daneben kann man Äste auf- und zuklappen und mit zweimaligem Klicken sogar die Grafik des entsprechenden Objektes nachladen. Dies erlaubt endloses Browsen durchs gesamte Biblionetz... (geht derzeit leider noch nicht, weil noch praktisch keine Objekte entsprechend upgedatet wurden...)
Ausprobieren lässt sich das bisher bei folgenden Seiten
- Biblionetz:w01911 Schreiben am Computer
- Biblionetz:w01919 Veröffentlichen von Text
- Windows XP (Tablet Edition):
- IE 6, Java 1.5
- Firefox 1.5.05, Java 1.5
- Opera 9, Java 1.5
- Mac OS X 10.4.7 MD (danke)
- Firefox 1.5.0.6, Java 1.5.0
- Safari 2.0.4, Java 1.5.0
- Opera 9.00 beta , Java 1.5.0
Kontakt
- Beat Döbeli Honegger
- Plattenstrasse 80
- CH-8032 Zürich
- E-mail: beat@doebe.li
About me
Social Media
This page was cached on 29 May 2026 - 00:22.