Archiv
Kategorien
Ärgernisse.
Biblionetz.
Elektromobil.
Gadgets.
Geek.
Ideen.
Informatik.
IA.
iPhone.
Medienbericht.
MedienBildung.
OLPC.
PH Solothurn.
PHSZ.
Schule & ICT.
Scratch.
Software.
Tablet-PC.
Veranstaltungen.
Visualisierungen.
Video.
Wiki.
Wissenschaft.
Mehr als 0 und 1
Letzte Postings
- Die Informationsflut-Pegelstandanzeige04 Jan 2024 - 12:36 1
- Sind Fremdeinschätzungen von ICT-literacy zuverlässig?06 Dec 2023 - 11:12 1
- Bahninfo 202314 Sep 2023 - 18:38 1
- Sommerlektüre: Bauplan für eine Seele26 Jul 2023 - 09:14 2
- Sollten wir weniger arbeiten weil uns die Digitalsierung Routinearbeiten abnimmt?04 Jul 2023 - 19:35 3
- Verlängert die Digitalisierung die notwendige Ausbildungszeit?24 Jun 2023 - 13:29 1
- Warum soll ich lernen, was die Maschine (besser) kann?07 Apr 2023 - 20:20 3
- Computational Thinking zum Verständnis des digitalen Leitmedienwechsels02 Feb 2023 - 15:33 5
- Die Frage «Wie verhindern wir die Nutzung von X in Kompetenznachweisen?» ist legitim, hat aber nur dritte Priorität.08 Jan 2023 - 14:41 5
- Gaslaternen-Forschung20 Jul 2022 - 11:30 2
 für gesamten Blog
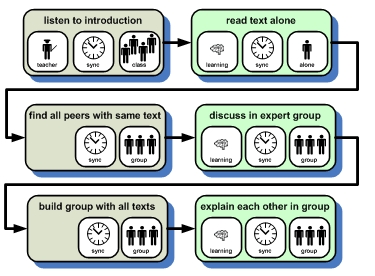
Vizualising the jigsaw method
I'm playing around with my new tool to visualize learning scenarios. The jigsaw method seems to be a touchstone: Will it be possible to grasp the essential of this famous learning scenario? A first approach is not very promising: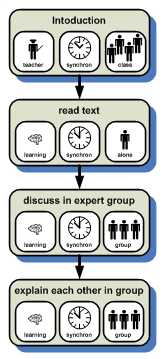
Zum Kommentieren ist eine Registration notwendig. Kategorien: IsaBlog, IsaVisualisierung, IsaDPM, IsInEnglish
Kontakt
- Beat Döbeli Honegger
- Plattenstrasse 80
- CH-8032 Zürich
- E-mail: beat@doebe.li